So many of the cartographers I’ve gotten to know while writing about maps seem to genuinely love their jobs. It’s one of those professions with a disproportionate number of people who are really happy to be there. I suspect that one reason for this could be that many of them have loved maps since they were kids, and they’ve managed to turn that love into a career.
This collection of childhood maps made by eight professional cartographers backs up that theory. I interviewed each of them about their early mapmaking, how they found their way into cartography, and what they love about their jobs today.
Their stories all have their individual quirks, but there are some common threads. Several of them recall spending family trips poring over a road atlas in the back seat, for example. And some can still recall the precise moment when they knew they would make maps for a living.
Share your own stories and childhood maps with us in the comments or on Twitter @mapdragons.
Kristen Grady (Above)
GIS specialist, New York City Emergency Management
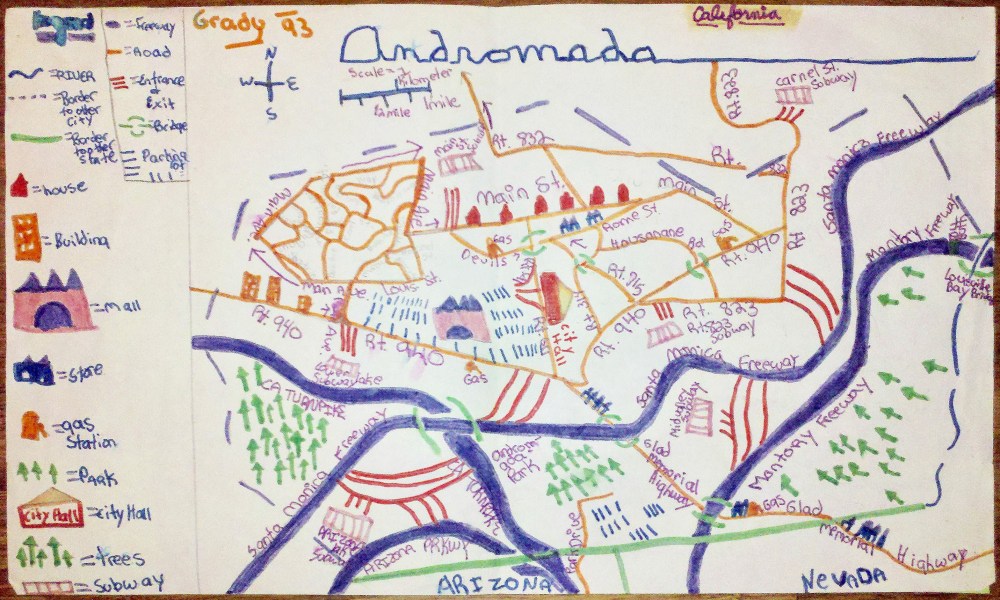
Andromada is an imaginary mashup of places 11-year-old Kristen Grady had been. A recent family trip to California was the inspiration, but there are also elements of her hometown (in the Poconos of Pennsylvania), as well as echoes of New York City. She thinks the name was most likely inspired by the 1971 sci-fi film “The Andromeda Strain,” one of her dad’s favorites.
At the time, Grady’s fifth-grade teacher was really into geography and made his students draw maps all the time. “He was an amazing teacher,” she says. “Probably the best I ever had.”
Another trip to California during her college years set her on a professional cartography track. It was her first encounter with those digital in-flight maps that track the plane’s progress. She spent the entire flight taking pictures of everything that looked interesting on the ground below, then taking a photo of the map after each one. Back at home, she checked the photos against Google Earth to identify everything she had seen.
“I was like, Oh my God, I’ve never enjoyed anything so much as I’m enjoying doing this right now,” Grady says. “I need to go back and study this stuff.”
Within weeks of that trip she’d switched her major from philosophy to geography. She went on to get a master’s degree in Geographic Information Systems, and today she works as a GIS specialist at New York City Emergency Management, handling data and making maps to help the city prepare for and respond to all sorts of emergencies.
“We do a lot with weather-related events, like coastal storms, hurricanes, snow storms,” she says. “We had a tornado once. It’s really exciting.”
And Grady is still making maps for fun too, doing some freelance cartography on the side.

Erik Steiner
Co-director of the Spatial History Project, Stanford University
What Erik Steiner remembers most about making this map are the mistakes. “I had no idea where Wales was, what it was, or anything,” he says. “So I drew it as an island.” He was crushed when someone pointed out the error—a feeling he can still relate to.
“I think all cartographers have a little bit of that neurosis,” he says. “They’re interested in getting it just right, because you have this responsibility of representing things truthfully.”
According to his mother, Steiner started making maps very young, perhaps even before he was five. He was one of those kids who spent family road trips buried in an atlas in the back seat. “There was a kind of fascination with the representational nature [of maps],” he says. “How the world outside can all be captured in this small space.”
For Steiner, geography was a way to incorporate his love of making things into a career. The combination of science and technology with humanities, along with the artistic aspects of cartography, was appealing. Early in his career he focused on the technological side of digital maps, doing a lot of programming and coding. In his job at Stanford’s Spatial History Project, he spends more time on cartography, working with people in the humanities and mapping things like emotional geography.
One of Steiner’s most recent projects with the Stanford Literary Lab involved crowdsourcing interpretations of the emotions connected to locations in London from 17th and 18th century literature. After a computer program identified places mentioned in novels, contributors would read a chunk of text surrounding the location and decide which emotion, if any, was expressed. Happiness and fear turned out to be the easiest to identify. The result is a series of maps of those emotions over time.
Eric Fischer
Data artist and software developer, Mapbox
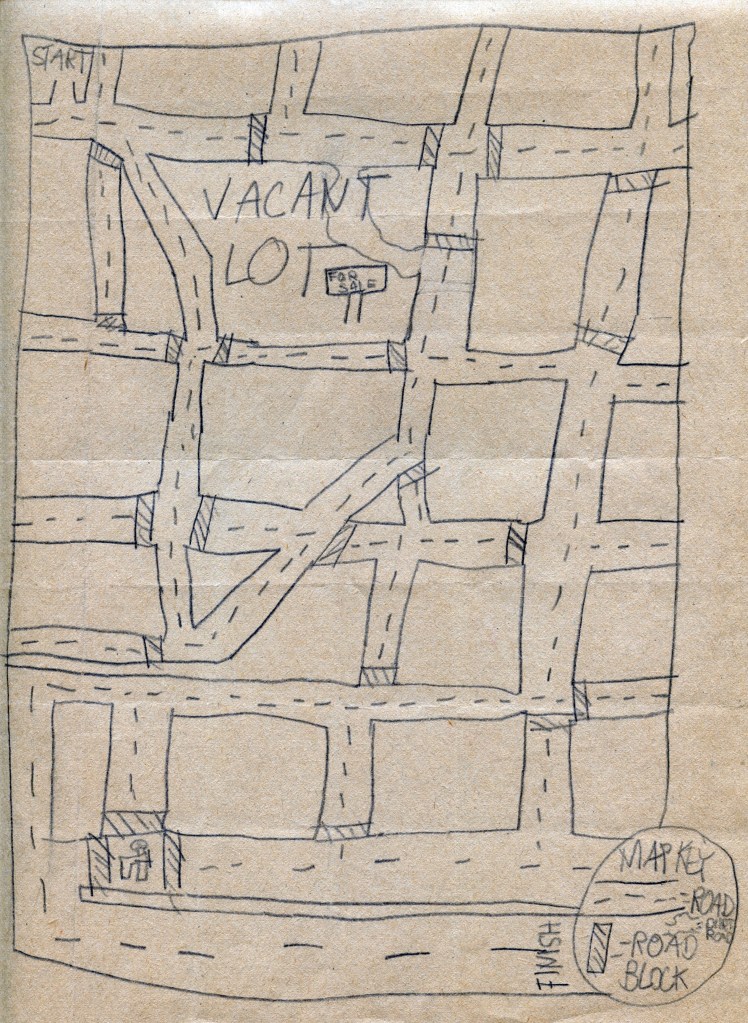
Watching the Dukes of Hazzard may have been what inspired Eric Fischer to draw this map when he was around seven years old. “Because where else would all these road blocks and stuff have come from?” he asks.
Fischer remembers being more into drawing mazes with his brothers than drawing maps. But in college he stumbled across the obsession that would eventually lead him into cartography. In a library at the University of Chicago, he discovered a bunch of old city transportation planning reports. The one from 1939 contained a plan to build a highway system on top of Chicago’s decaying, 50-year-old elevated train lines.
“It was this kind of insane plan,” Fischer says. “I think that really got me interested in historical transportation planning.”
He followed that interest when he moved to San Francisco, his current home. He started posting some of the city’s plans for freeways that never happened, and soon he was making his own maps of things like locals versus tourists and race and ethnicity. Fischer’s mapping skills eventually landed him at Mapbox, where he works on tools for people to do their own analyses and visualizations of data, such as the Geotagger’s World Atlas.
“It’s a great place for doing things where you can just get it out to the public right away and make things that anybody can use on their own data,” he says.

Matthew Hampton
Principal cartographer, Oregon Metro
Armed with tracing paper and the Encyclopedia Brittanica, Matthew Hampton set out to make a map for a fourth-grade report on Indonesia. He started tracing and pretty much got lost while trying to re-create the map. “I had the feeling that I could keep making this map forever,” he says. But he ran out of time before he could finish trying to fill in the bathymetry.
It would be a long time before Hampton lost himself in a map again. After college, while working as a wilderness guide for Outward Bound, he volunteered to make a map of the Deschutes River for an expedition. “And it was pretty good!” he says.
Shortly after that, near the end of a monthlong expedition on the Deschutes and Mount Washington, he and two other guides were trying to figure out why so many of the kids on the trip were getting lost on a particular part of the mountain. Eventually they found the problem: The map the kids were using showed just one drainage where there were actually two.
This got Hampton thinking about how maps are made, and that led him to get a master’s degree in GIS—and to start making maps himself. He spent the next two decades mapping the Portland area for Oregon Metro.
“I like both the analytic and artistic aspects of it,” he says. “I like trying new things and stretching boundaries. And this field provides a lot of room for tinkering around with things and coming up with new ideas for old problems.”
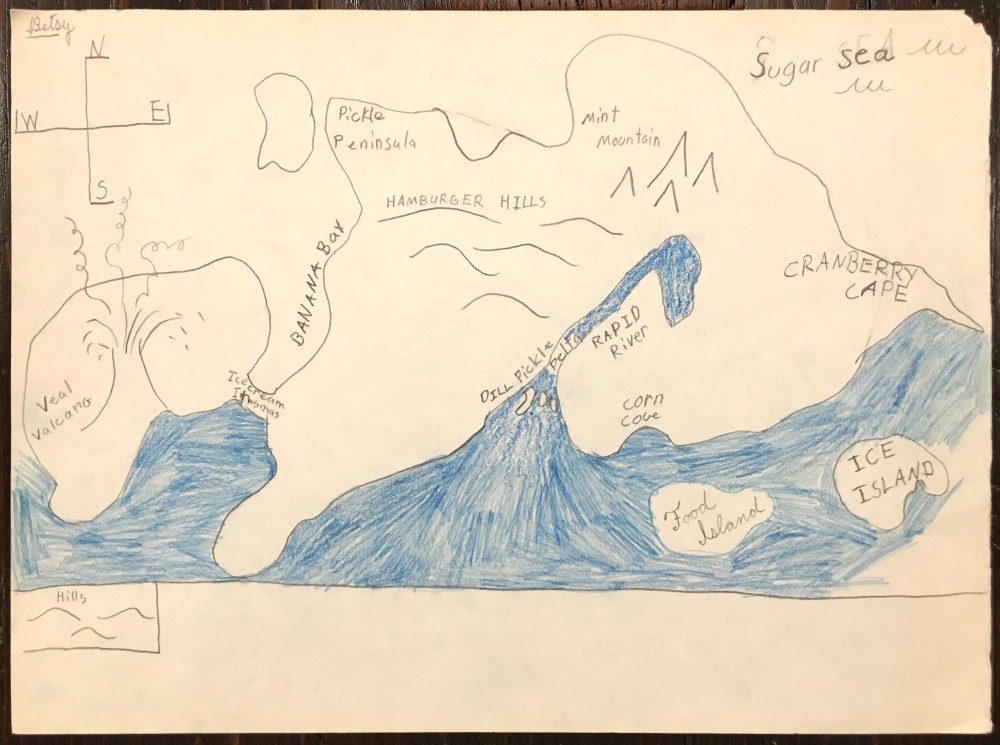
Mike Foster
Data visualization specialist, MIT Department of Urban Studies and Planning
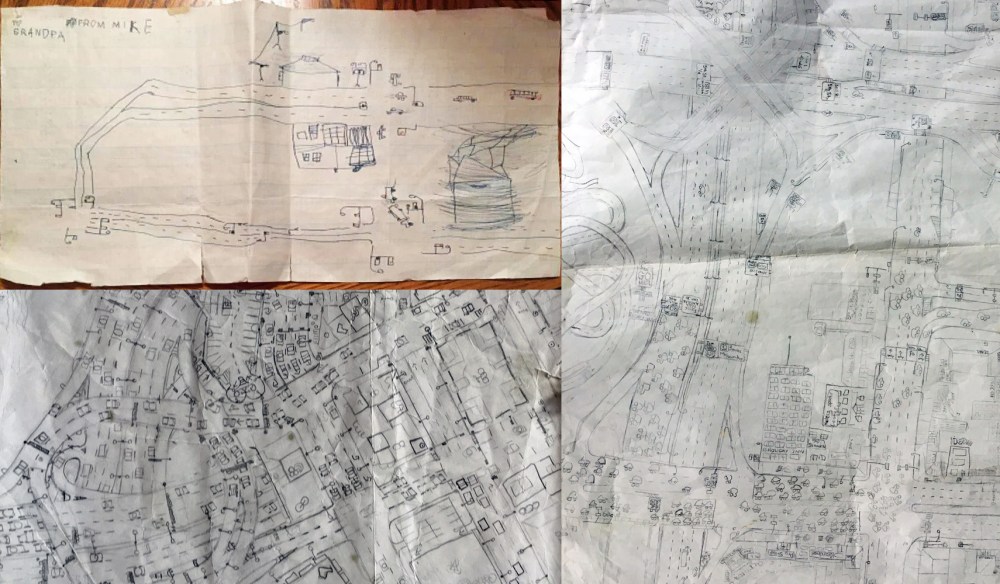
A couple of years after Mike Foster’s grandfather passed away, his grandmother found a hand-drawn map tucked away in his grandfather’s sock drawer. It bore the inscription “To Grandpa from Mike.” Foster thinks he was probably around five years old when he made it.
Foster has been drawing maps since he can remember, of places both real and imaginary (like the maps above). Drawing maps has always helped him clear his head. “It’s almost like a form of meditation to me,” he says. “There’s something very zen about it.”
It wasn’t until college that Foster realized he could turn his love of mapmaking into a career. After about two years of working toward a civil engineering degree, he found himself in the library doing research for a geography paper. But he ended up spending hours looking at maps and reading about maps that were unrelated to the assignment.
“Everything kind of clicked right there,” he says. Within weeks he had changed his major to cartography and GIS.
Today Foster works at MIT doing what he loves best: making maps. He says the work varies a lot, from really technical work like parsing data and writing Python code to the more artistic side of plotting the data and deciding how it should look. His grandfather would undoubtedly have approved.
“My grandpa was a graphic artist,” Foster says. “He was huge role model in my life. He’s a big reason I do what I do.”

Rosemary Wardley
Cartographer, National Geographic
A class assignment to map out a family fire-escape plan probably seemed like more than just an exercise to young Rosemary Wardley. A couple of years earlier, some sheds behind her house had caught on fire. “I’m sure that was in the back of my mind,” she says.
And that’s likely why none of the paths she drew for her family members went out the back door toward the sheds. On the other hand, she deemed it perfectly safe to direct her oldest sister to jump into a pine tree outside of a second-story window (upper left on the map).
The hallway outside of “Rosie’s room” (upper right) was covered in U.S. Geological Survey topographical maps, and this wall was often Wardley’s first stop after a drive or a hike.
“I always kind of went back there and had my dad point out where we had gone,” she says. “Thinking back, that’s definitely the biggest thing that influenced me as a cartographer. It just made me have that love of geography.”
Today, Wardley works at National Geographic, where she says the cartography is very collaborative. She makes maps for stories such as a photographer’s trek across China, but a lot of her time is spent editing and working with the data that goes into the maps. It’s the variety that appeals to her most, she says.
“There’s always different opportunities to practice the craft. There’s always another map to be made.”
Andy Woodruff
Cartographer, Axis Maps
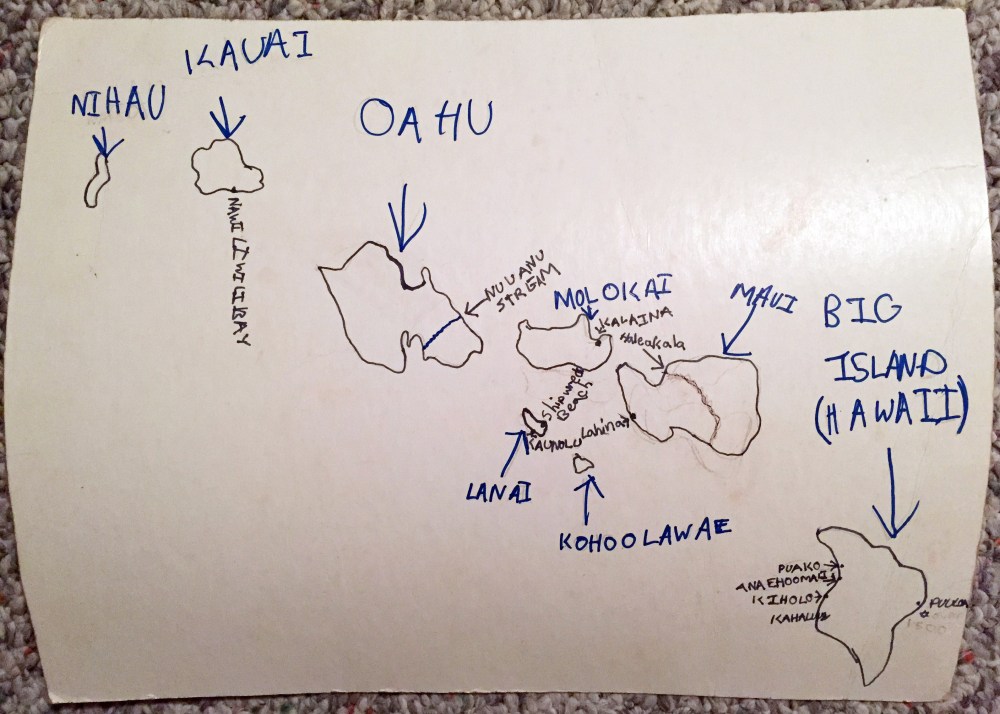
Andy Woodruff estimates he was around seven when he made this map of Hawaii, based on when his dad was stationed there with the Air Force, plus the handwriting and spelling on the map. “A couple of those islands are spelled wrong,” he says. “But I’m pretty sure adults would spell a lot of those wrong too.”
A self-described lifelong map nerd, Woodruff “was always, you know on family trips, the kid in the back of the car just looking at the atlas.” Take that love of maps and add a fascination with almanacs and demographic data, and you have the makings of a geographer. Woodruff got his master’s degree in geography at the University of Madison-Wisconsin, where he focused on GIS and cartography.
These days he’s a cartographer at Axis Maps, where he makes all sorts of web interactives, such as a map of global volcanic and seismic activity for the Smithsonian’s National Museum of Natural History.
“We take on a variety of projects,” he says. “Every one of them is a different topic. It’s a good chance to learn about something else in the process.”
He also makes maps in his spare time, like the popular “Beyond the Sea” series that we included in our favorite maps of 2016.
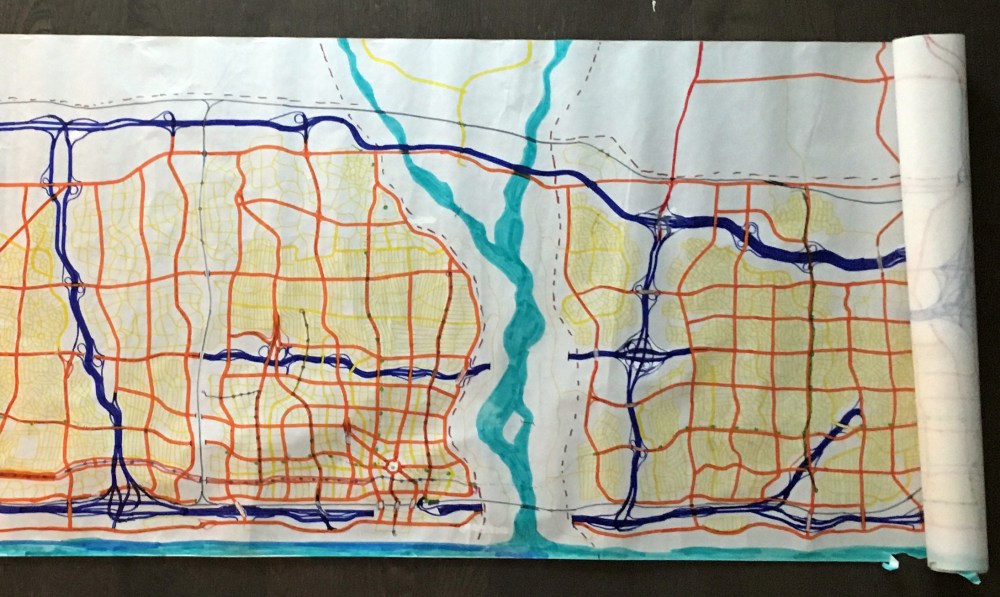
Jeff Allen
Spatial Analysis Researcher, University of Toronto
Jeff Allen estimates that between ages 5 and 14, he filled around a half dozen 20- to 30-foot-long rolls of paper with maps of imaginary cities like the one above. The shoreline is probably inspired by his hometown of Toronto, but Allen says he was following the urban form of a typical North American city, as well as mimicking the cartographic design of maps he had seen.
“As a kid I was just always fascinated with cities and walking around the city,” he says. “I guess it translated into something I could draw rather than what other kids would typically draw at the time.”
Today, Allen is a researcher in the Spatial Analysis of Urban Systems Lab at the University of Toronto, where he works on a variety of topics such as students’ travel behavior and the accessibility of transportation, jobs, and healthy food. He really likes the variety of his job, which includes cartography, graphic design, data analysis and visualization, research, writing, coding, and programming. At the same time, he is working toward a master’s degree in geography and doing freelance cartography on the side.
Of course, not every young map nerd grows up to be a cartographer. I recently found this map while helping my parents rescue boxes from their flooding basement. I don’t remember making it, but I’m guessing it was an unfinished geography assignment, or was at least inspired by learning about various landforms in school.
I do remember liking maps, though, and I know that making them was part of what led me to become a geologist (before I became a journalist). And of course, my love of maps is why I write about them today. So in a way, I managed to make them part of my career, too.
This article was originally published on our blog All Over the Map at National Geographic.
